Basic quality assurance and control
Last updated on 2023-06-24 | Edit this page
Overview
Questions
- How can you keep data entry clean?
Objectives
- Apply quality assurance techniques to limit incorrect data entry.
- Apply quality control techniques to identify errors in spreadsheets.
When you have a well-structured data table, you can use several simple techniques within your spreadsheet to ensure the data you enter is free of errors. These approaches include techniques that are implemented prior to entering data (quality assurance) and techniques that are used after entering data to check for errors (quality control).
Quality Assurance
Quality assurance stops bad data from ever being entered by checking to see if values are valid during data entry. For example, if research is being conducted at sites A, B, and C, then the value V (which is right next to B on the keyboard) should never be entered. Likewise if one of the kinds of data being collected is a count, only integers greater than or equal to zero should be allowed.
To control the kind of data entered into a a spreadsheet we use Data Validation (Excel) or Validity (LibreOffice Calc), to set the values that can be entered in each data column.
Select the cells or column you want to validate
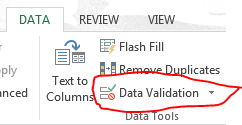
On the
Datatab selectData Validation
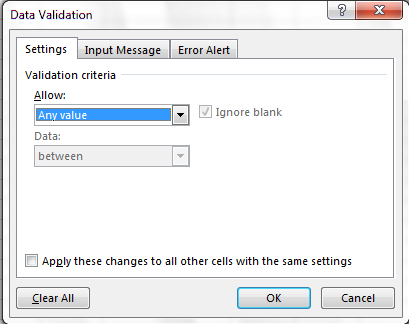
- In the
Allowbox select the kind of data that should be in the column. Options include whole numbers, decimals, lists of items, dates, and other values.
- After selecting an item enter any additional details. For example if
you’ve chosen a list of values then enter a comma-delimited list of
allowable values in the
Sourcebox.
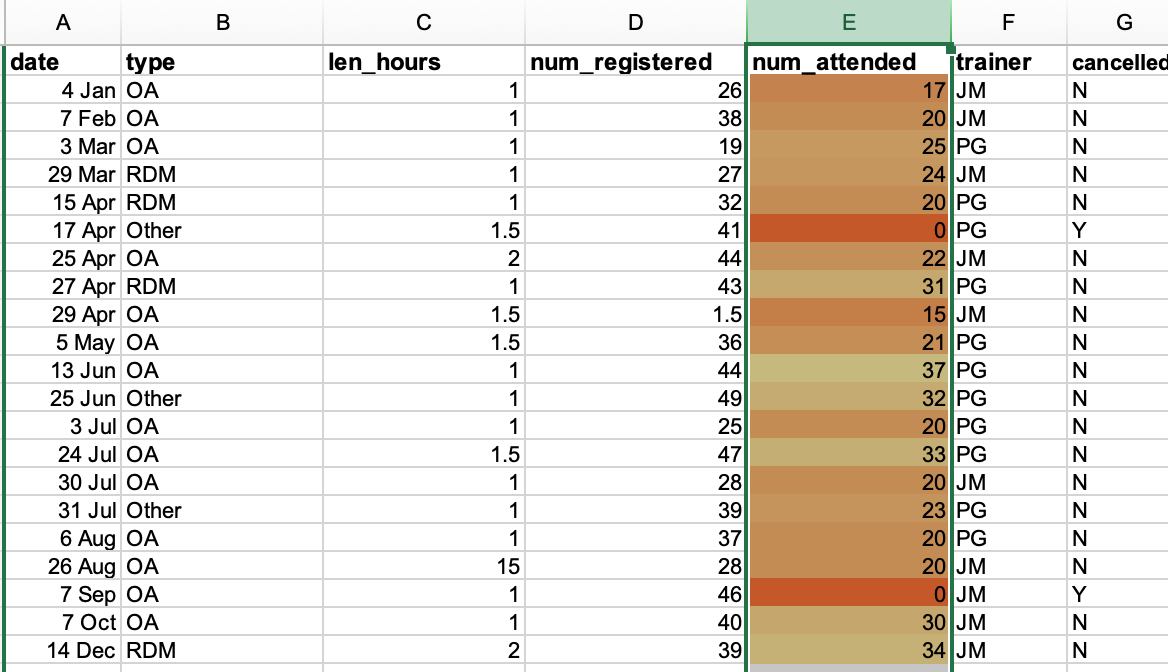
We can’t have half a person attending a workshop, so let’s try this
out by setting the num_registered column in our spreadsheet
to only allow whole numbers between 1 and 100.
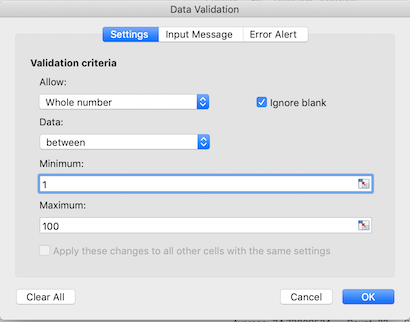
- Select the
num_registeredcolumn - On the
Datatab selectData Validation - In the
Allowbox selectWhole number - Set the minimum and maximum values to 1 and 100.
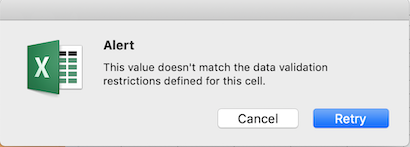
Now let’s try entering a new value in the num_registered
column that isn’t a valid class size. The spreadsheet stops us from
entering the wrong value and asks us if we would like to try again.
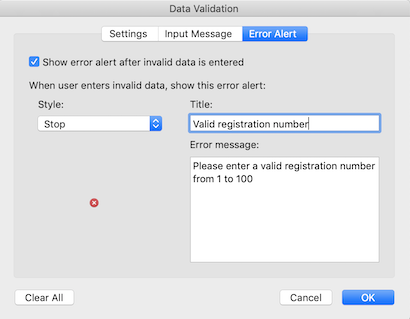
You can customize the resulting message to be more informative by
entering your own message in the Error Alert tab, and you
can edit the Style for when a non-valid value is entered,
by not allowing other values or just give a warning about non valid
entries.
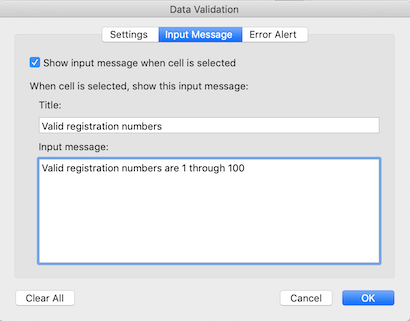
to display a (pop up) message about the correct values for a column
with Data Validation set, use the Input Message tab.
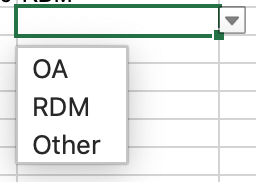
Quality assurance can make data entry easier as well as more robust. For example, if you use a list of options to restrict data entry, the spreadsheet will provide you with a drop-downlist of the available items. So, instead of trying to remember the workshop title abbreviation, you can just select the right option from the list.
Quality Control
Tip!
Before doing any quality control operations, save your original file with the formulas and a name indicating it is the original data. Create a separate file with appropriate naming and versioning, and ensure your data is stored as values and not as formulas. Because formulas refer to other cells, and you may be moving cells around, you may compromise the integrity of your data if you do not take this step!
readme (README) files: As you start manipulating your data files, create a readme document / text file to keep track of your files and document your manipulations so that they may be easily understood and replicated, either by your future self or by an independent researcher. Your readme file should document all of the files in your data set (including documentation), describe their content and format, and lay out the organizing principles of folders and subfolders. For each of the separate files listed, it is a good idea to document the manipulations or analyses that were carried out on those data. Cornell University’s Research Data Management Service Group provides detailed guidelines for how to write a good readMe file, along with an adaptable template.
Sorting
Bad values often sort to bottom or top of the column. For example, if your data should be numeric, then alphabetical and null data will group at the ends of the sorted data. Sort your data by each field, one at a time. Scan through each column, but pay the most attention to the top and the bottom of a column. If your dataset is well-structured and does not contain formulas, sorting should never affect the integrity of your dataset.
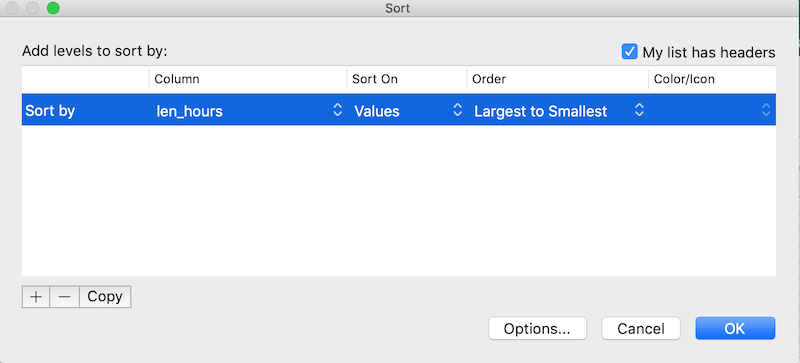
Click the Sort button on the Data tab in Excel. A pop-up will appear.
The following window will display, choose the column you want to sort as well as the sort order.
Note how the odd values sort to the top. The cells containing “min”
or “hour” are found towards the top. Larger values like 90, 60 and 15
also are sorted so you can evaluate them. This is a powerful way to
check your data for outliers and odd values. 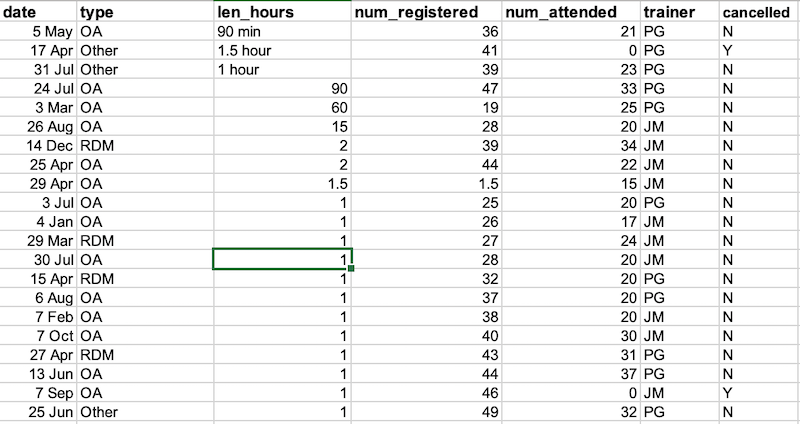
Conditional formatting
Use with caution! But a great way to flag inconsistent values when entering data.
Conditional formatting basically can do something like color code your values by some criteria or from lowest to highest. This makes it easy to scan your data for outliers. It is nice to be able to do these scans in spreadsheets, but we also can do these checks in a programming language like Python or R, or in OpenRefine or SQL.
We can now quickly see the two outlier cells with the value of
0 and can also see that these two classes were
canceled.