Image 1 of 1: ‘Two images of a DMC Delorian: left is a standard model and on the right is one that has been modified into the time machine from 'Back To The Future'’
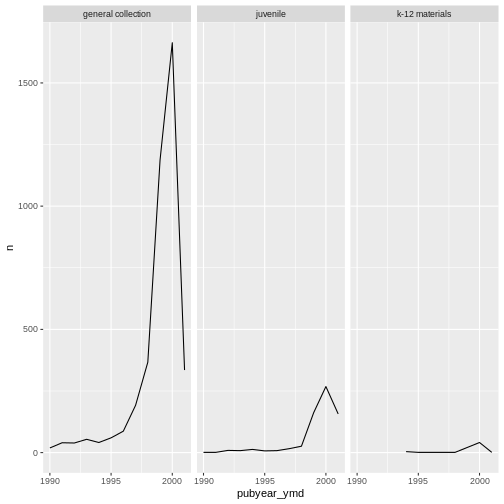
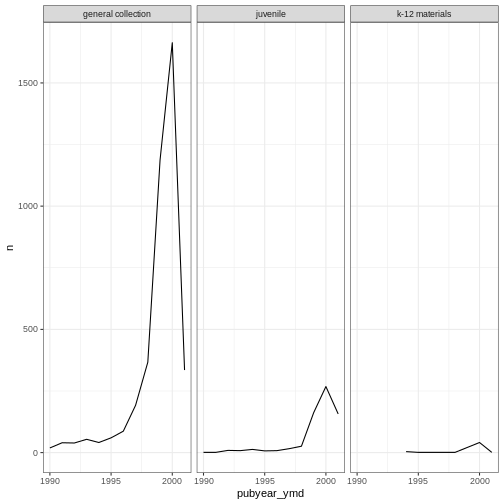
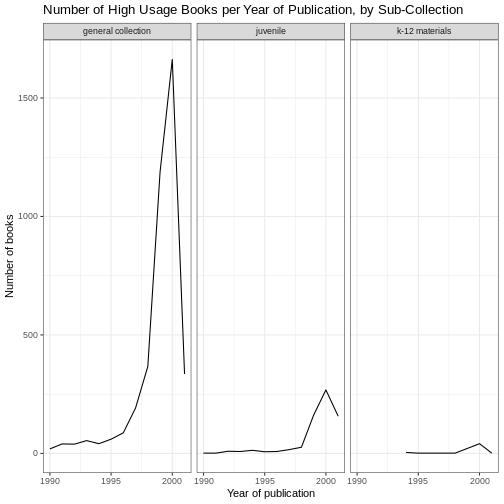
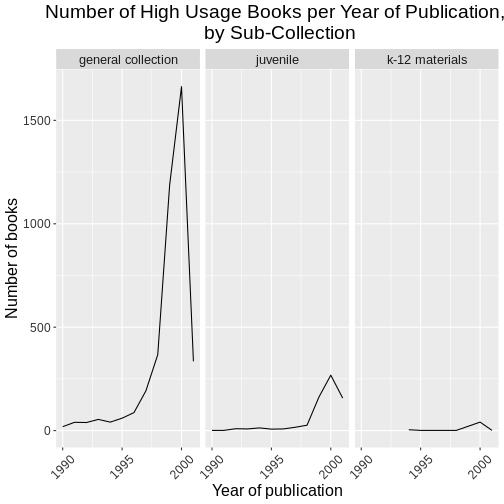
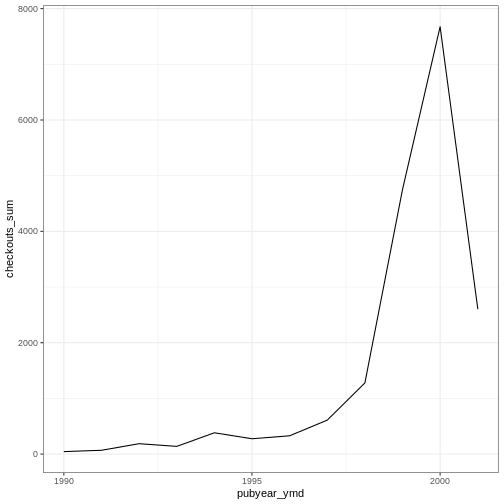
Image 1 of 1: ‘Three line plots, one each for general collection, juvenile, and K-12 sub-collection materials, showing the relationship of count of books to publication year’